Thursday 25 August 2011

An Update for the Arachne-Pleiades annotations

After some bug fixing and general fiddling, we are happy to announce a 'new and improved' version of the 'Arachne to Pleiades matching'. The earlier blogpost explains the main efforts behind this work: here I will mention what has been improved since the first delivery of annotations.

The major new features are:
* Human readable contents behind the Arachne URIs (places, topographical units, objects)
* Improved matching labels using regular expressions
* Annotation of Arachne objects

1. Human readable content behind an URI

This means that the URIs in the annotations can now be used to check what lies behind them and deliver the results in a human friendly form. Normaly an URI is "just" an Identifier, but If you copy the URI of Arachne Dataset to your adressbar the Brower redirects you to the identified Arachne Entity in the Arachne Database. The URI can also be used as an URL.

Examples:
Object: http://arachne.uni-koeln.de/entity/1075708
Place: http://arachne.uni-koeln.de/entity/1206008
Topographical Unit: http://arachne.uni-koeln.de/entity/5152

2. The matching of the labels from Pleiades has been enhanced in the following way:

The old matching like described in step 2 has been enhanced by using regular expressions in the SQL-queries. Regular Expression are a standard, for the expression of text-search patters. These expressions .The Pleiades labels have been cleaned of any regular expression characters like . ? * [ ] and (), which would interfere with the matching process. In addition labels smaller than three characters are ignored because with the regular expressions they could create too many meaningless matches. The new matching, for example, handles that the labels of the Pleiades data set are correctly matched to fields that contain enumerations of Place names.

For Example a field with alternative Placenames contains "athen,atenes,athens" Then it wont match exactly to the string "athen" (the german Version). Its a substring of the String "athen,atehes,athens".
On the otherhand we don't want to match "athen" with "rathenow". Rathenow is not even near Athens. This Problem can only be solved with an Text search pattern like a Regular Expressions.

Also some bugs have been fixed that unintentionally lead to skipping some Pleiades labels in the matching process.


3. Annotations of Arachne Objects:

The data has also been extended, so now the annotations contain links to objects, which form the largest part of the Arachne Database. For every matched place in Arachne the objects that refer to these places are collected.
for example:
A Pleiades Places Links an Arachne Place which Links some Arachne Objects.
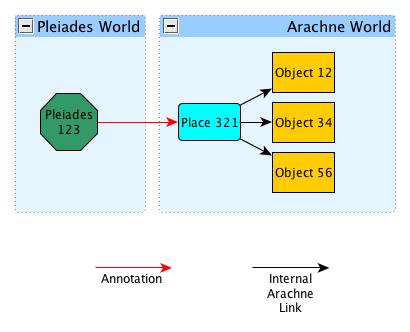
Now the script links the Arachne Objects directly to the Pleiades Place, skipping the Arachne Place.


This is done in context of Step 4.

These changes sound quiet small but they have an imense impact. The bugfix and some other changes have been more than doubling the ammount of Arachne Place to Pleiades Place annotations. The Annotations of Objects nearly exploded. As seen in the Example pictures each Place Link creates several Annotations linking Arachne Objects to Pleiades Places.
Connections Links these tend to explode. If the average Arachne Place is connected to 5 Arachne Objects there are 5 Times more Pleiades Place to Arachne Objects Annotations than there are Pleiades Place to Arachne Place annotations!

Thursday 11 August 2011

(Re-)Using the Graph Explorer Pt. 2: API

The PELAGIOS Graph Explorer HTTP API exposes the data from the visualization in JSON format, with Place geometry encoded as GeoJSON. Since the Graph Explorer runs entirely on the API internally, all of the operations you can see in the visualization are also available through the API - from place search to finding intersections between datasets, to getting the source data references.

The design of the API has been somewhat ad hoc: the approach was to be pragmatic, quick, and build in the essentials needed for the visuals, no more, no less. If you are re-using it for other purposes which we haven't anticipated (different types of visualizations, analyses, etc.) you are likely to encounter situations where you lack certain features, would have expected things to be named or organized differently, or miss a bit of documentation here and there, I assume. But bear with us - it's an alpha version & this is exactly the kind of feedback that's valuable for us! We're excited about anyone trying out things with the API we haven't thought of!

Visit our Wiki to learn the basics and see some live examples.

P.S.: An online demo of the PELAGIOS Graph Explorer is available here. Screencasts explaining the basic usage are in this blogpost: The PELAGIOS Graph Explorer: A First Look

(Re-)Using the Graph Explorer Pt. 1: Technology

As announced, I would like to use the next couple of posts to provide a little technical information on our PELAGIOS datavisualization demo, aka the Graph Explorer.

In this post I'll provide a quick rundown of the technologies we have used to implement the demo. So if your interest is in understanding the code, deploying it on your own server, etc. then this post is for you!

If you don't care about the details under the hood, but want to use the API to build your own mashups: this will be covered in the next post.

If you're not interested in tinkering with the application at all, but rather want to know how you can get your own data into the graph, or create your own data aggregations: we'll cover that in part III, which will focus on the data-end of things.

Architecture


In terms of architecture, the Graph Explorer is a pretty standard Web application: the user interface is implemented in JavaScript, so it should run in any reasonably modern browser, with no need for extra plugins (i.e. no Flash or Silverlight involved). It makes heavy use of Scalable Vector Graphics to visualize the graph, aided by a few little helper libraries underneath for added functionality and eye candy.

The server side is implemented in Java. To make things work at reasonable speeds, the Graph Explorer keeps an aggregation of PELAGIOS partners' data in a database. (Right now it's actually just a small sample subset of about 75.000 data records total.)

Rather than using a relational database, we have used the Neo4j NoSQL graph database. Not only does this fit better with the graph-like structure of our source data (which is RDF), it also has the added benefit that we get a range of graph algorithms for free: e.g. the shortest path search, which is what you will see when you search for multiple places (example). Personally, I also found it easier to work with Neo4j rather than a triple store: the recommended Neo4j practice of defining your own domain model (and then working with concrete instances of Datasets, Places and OAC Annotations, rather than a generic model of Nodes and Edges or Resources and Properties) just felt much more straightforward, results in more concise and readable code, and (in my opinion) easily makes up for the sacrifices in terms of 'genericness' and lack of a standardized query language.

Source Code & License


As all our work, the Graph Explorer is open. We're licensing it under the GNU General Public License v3.0. You can get the source code from our GitHub repository, which also contains detailed build and deployment instructions.

P.S.: An online demo of the PELAGIOS Graph Explorer is available here. Screencasts explaining the basic usage are in this blogpost: The PELAGIOS Graph Explorer: A First Look

Monday 8 August 2011

PELAGIOS Graph Explorer - The Live Demo

Just a short post to announce the availability of a live demo installation of the PELAGIOS Graph Explorer! Feel free to play with it at

http://pelagios.dme.ait.ac.at/graph-explorer

Mind that this is our development server, so the demo may be down occasionally as we are working on it.

Friday 5 August 2011

The PELAGIOS Graph Explorer: A First Look

The PELAGIOS project blog has been a little silent recently. But certainly not because of the summer - but rather because of some busy work that has been going on behind the scenes! Today I'd like to present some results of this work: the alpha version of the PELAGIOS Graph Explorer (working title ;-)

The Graph Explorer is a visualisation tool which lets you play with the data provided by the PELAGIOS partners, and explore the relations that now exists thanks to:
  • the alignment of all data with the Pleiades Gazetteer
  • the use of a common vocabulary to express place references

I'm planning to discuss the details - the components underneath the hood, the implementation, the Graph Explorer API - in a follow-up post. And there will also be a public demo instance you can try hands-on. But for now I'd just like to keep it short - and show what the tool looks like!

The first screencast explores how datasets from different PELAGIOS partners are related to each other through place. You can also view the original-resolution video for a clearer picture.


The second screencast takes the "inverse perspective" (so to speak) - and explores how different places in the PELAGIOS data are related to each other through data. The original-resolution video is here.


UPDATE: The online demo of the Graph Explorer is available at
http://pelagios.dme.ait.ac.at/graph-explorer